State of my Democracy — Dashboard implementation
VoteRunLead
Vote Run Lead (VRL) trains women to run for office and win — reaching tens of thousands of women across America, with alumni serving in city councils, state houses, supreme courts, and Congress. Their State of My Democracy platform examines the underrepresentation of women in state legislatures across the United States, with the goal of both educating the public and inspiring more women — particularly women of color — to run for office.
Based on designs provided by the Graphicacy team, we handled data processing, frontend development, and animation, building the platform in Next.js and delivering it in time for the 2022 US midterm elections.
Tiles gallery
Exploration with a clear purpose
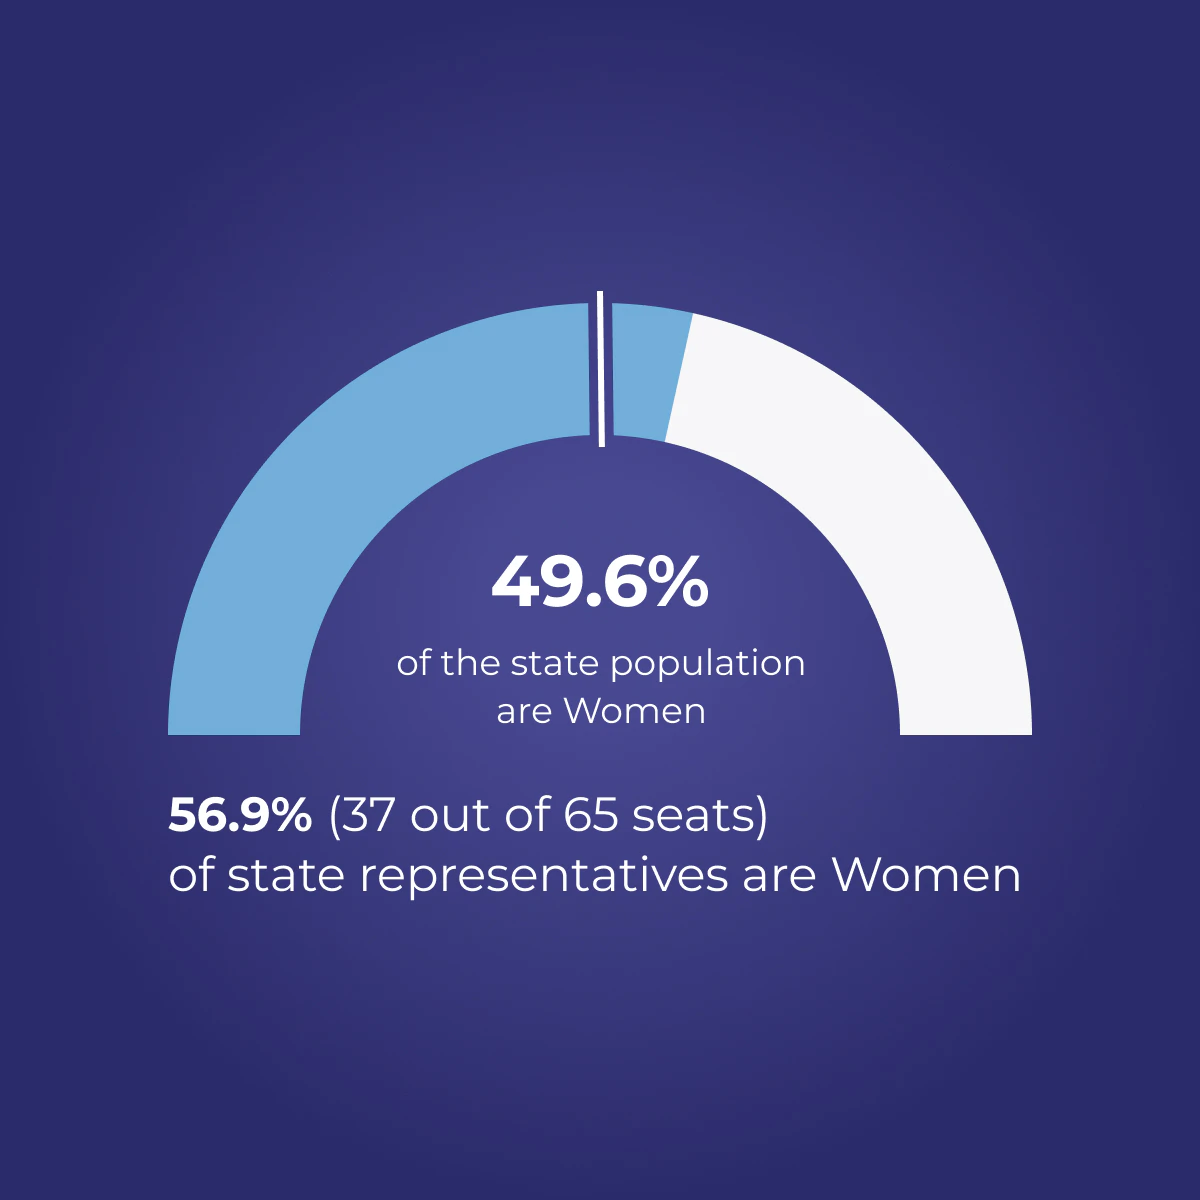
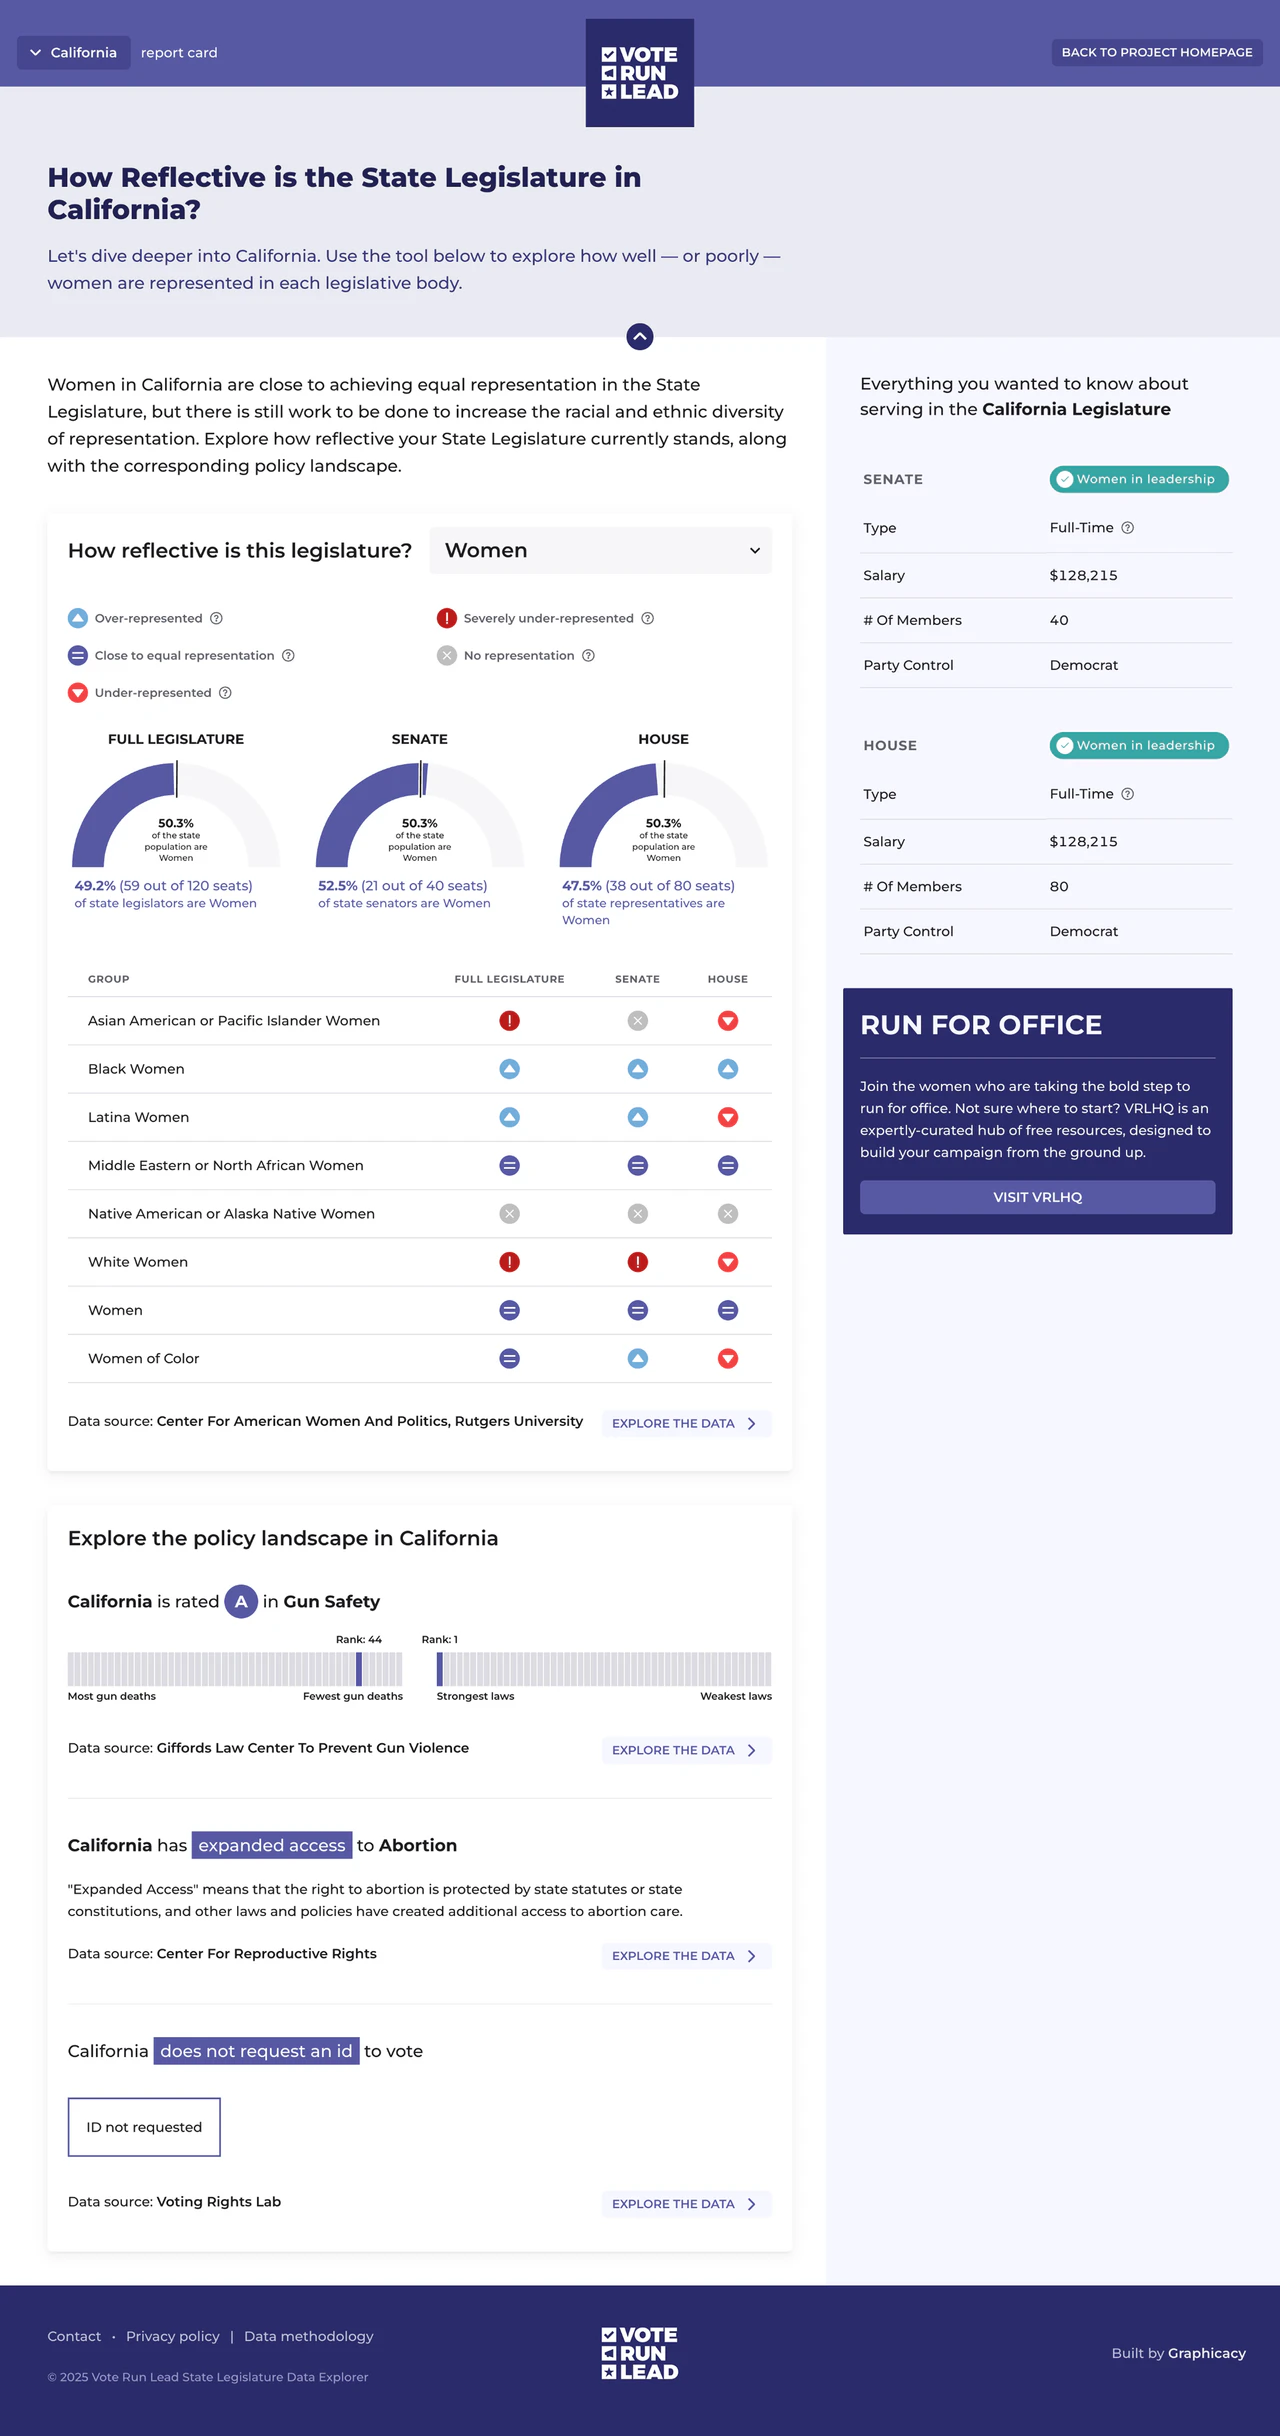
The interactive data tool lets users explore gaps in women's representation across all 50 states, broken down by racial and ethnic identity groups. At the national level, users can compare states at a glance; at the state level, a report card brings the data close to home, connecting representation figures to real policy outcomes on abortion access, gun safety, and voting rights.
The platform is designed to do two things at once — inform and motivate. Every data point is framed within a call to action, encouraging users to sign up for VRL's training or nominate a woman to run.
50 state profiles
Users can explore gaps in women's representation across all 50 states, broken down by racial and ethnic identity groups.
Shipped for the midterms
The 2022 US midterm elections set a hard deadline. We worked closely with the Graphicacy team to deliver a production-ready platform on time — built to handle the full scope of the data tool, the state report cards, and the scrollytelling experience within a tight timeline.